Rare Element Resources
Bear Lodge Project
Canadian NI 43-101 Technical Report
October 9
th
, 2014
10135-200-46 - Rev. 0
13-45
chloride). The column operated under steady state conditions and heat was
balanced.
(SGS Lakefield, 2014)
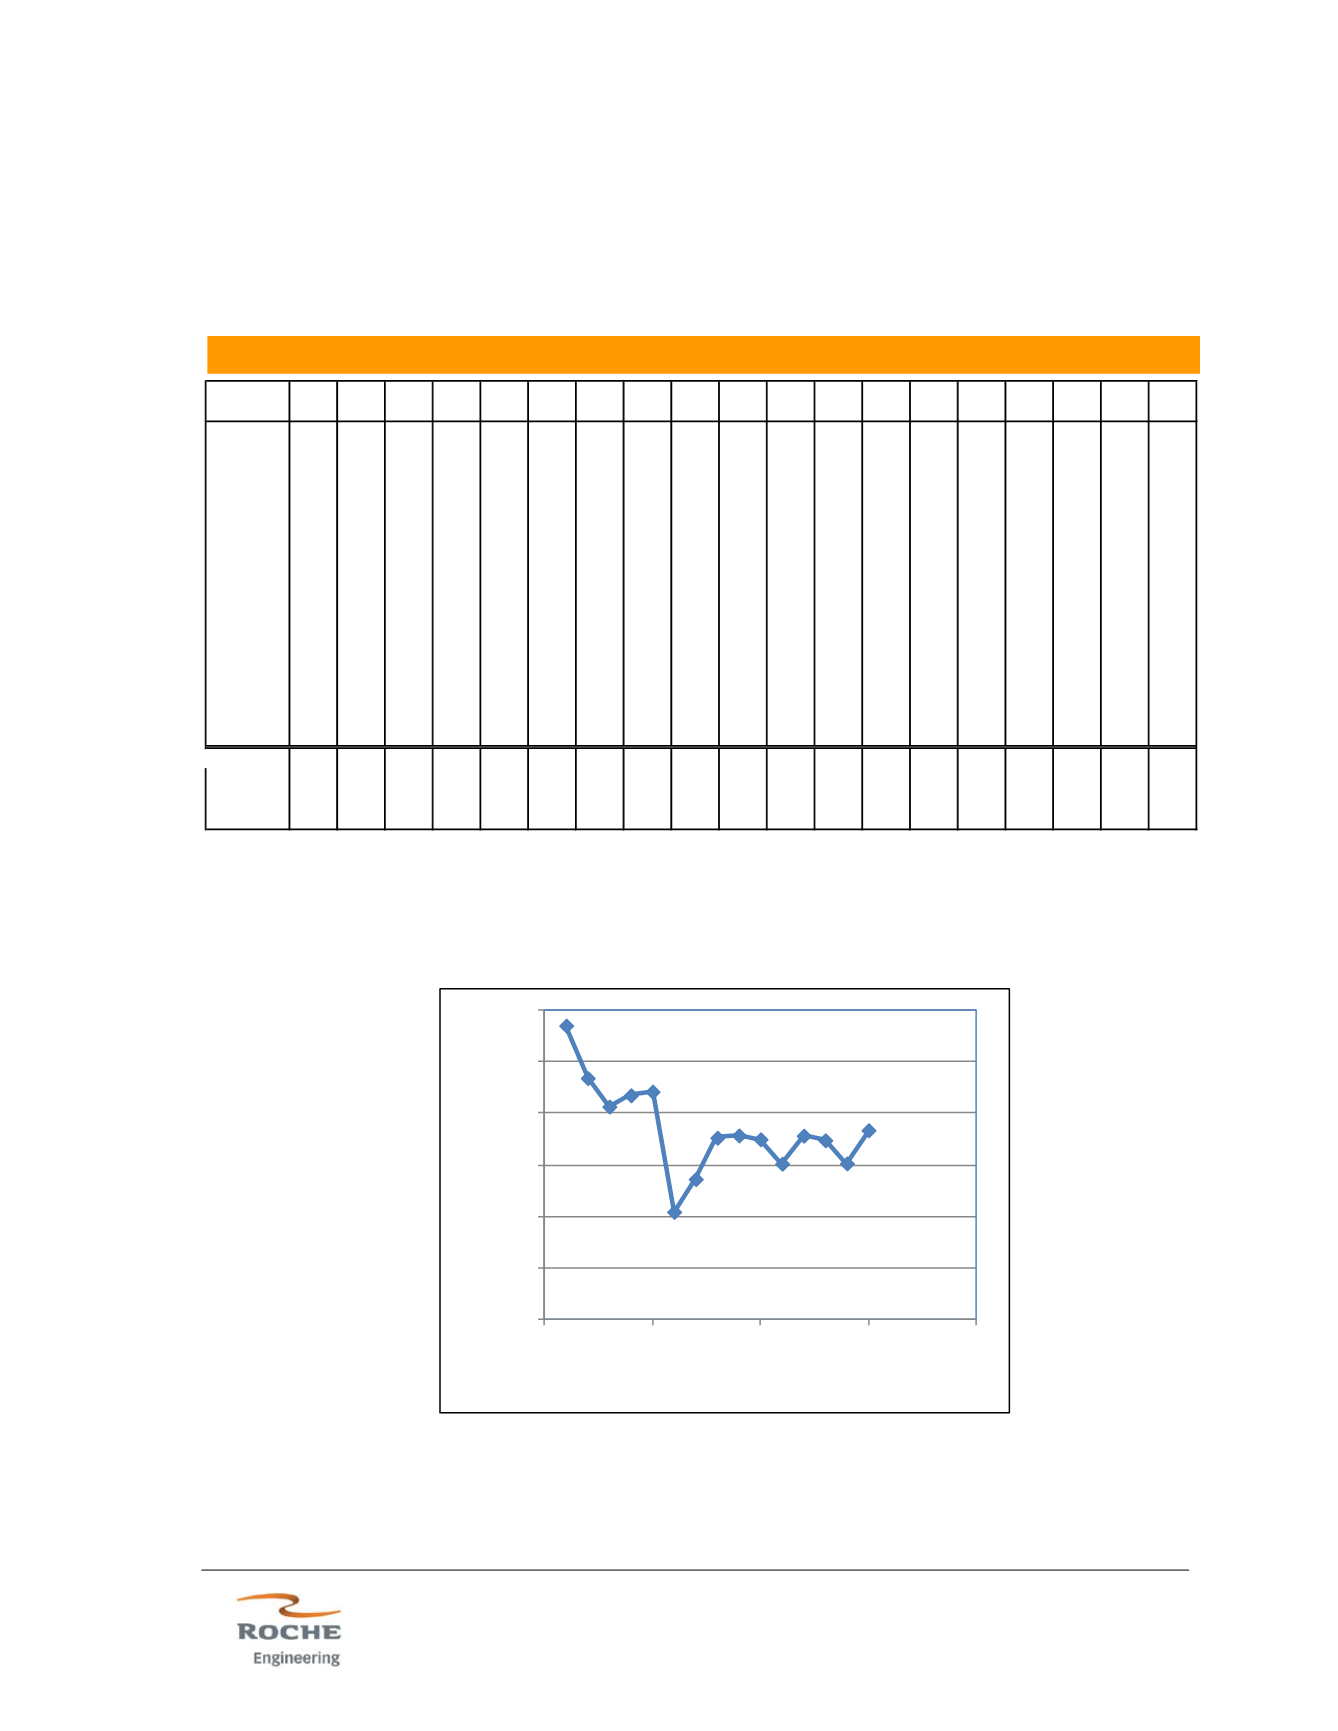
Figure 13.17 - Feed HCl acid to distillation column (recoverable)
(SGS Lakefield, 2014)
Free acid is determined by a free acid titration with sodium hydroxide solution and is
represented as grams of hydrochloric acid per liter of solution. Figure 13-17 shows
Cycle HCl
La Ce Pr
Nd Sm Eu Gd Tb Dy Ho Y Er Tm Yb Lu Sc Th U
g/L mg/L mg/L mg/L mg/L mg/L mg/L mg/L mg/L mg/L mg/L mg/L mg/L mg/L mg/L mg/L mg/L mg/L mg/L
1 92.8 372 296 28.3 78.4 6.62 1.41 3.32 0.26 0.97 0.14 5.87 0.31 0.05 0.21 0.04 0.09 0.41 9.84
2
114 990 1250 115 360 37.2 7.84 18.3 1.52 4.92 0.62 19.9 1.11 0.14 0.78 0.11 0.26 2.01 12.8
3 93.8
990 1250 115 360 37.2
1.21 3.13 0.29 1.14 0.18 9.21 0.41 0.05 0.31 0.04 0.10 0.44 9.08
4 82.7 114 51.5 3.20 6.37 0.34 0.07 0.19 0.03 0.09 0.02 1.09 0.06 0.04 0.04 0.03 0.08 0.08 6.94
6 87.1 157 87.9 6.00 13.2 0.74 0.14 0.33 0.04 0.15 0.02 1.57 0.05 0.04 0.04 0.03 0.07 0.08 7.20
7 88.5 177 107 8.04 18.5 1.27 0.25 0.68 0.06 0.28 0.04 2.40 0.10 0.04 0.09 0.03 0.07 0.06 6.98
8 74.9 28.8 10.3 0.85 2.13 0.12 0.03 0.07 0.03 0.05 0.02 0.11 0.04 0.04 0.02 0.03 0.07 0.03 7.32
9 41.8 22.8 10.2 0.71 1.66 0.12 0.03 0.06 0.03 0.05 0.02 0.18 0.04 0.04 0.02 0.03 0.07 0.03 6.19
10 54.5 22.8 8.70 0.47 1.08 0.07 0.03 0.03 0.03 0.05 0.02 0.09 0.04 0.04 0.02 0.03 0.07 0.05 8.22
11 70.6 82.6 43.0 2.22 4.67 0.30 0.06 0.15 0.03 0.05 0.02 0.69 0.04 0.04 0.02 0.03 0.07 0.05 10.5
12 71.5 27.0 10.0 0.63 1.46 0.11 0.03 0.05 0.03 0.05 0.02 0.13 0.04 0.04 0.02 0.03 0.07 0.14 8.75
13 70.0 102 55.3 5.22 13.2 0.99 0.21 0.53 0.05 0.21 0.04 1.81 0.09 0.04 0.08 0.03 0.07 0.08 8.45
14 60.5 94.0 39.7 2.96 6.23 0.37 0.08 0.21 0.03 0.10 0.02 1.60 0.07 0.04 0.06 0.03 0.09 0.06 7.41
15 71.4 163 88.1 6.72 15.5 1.02 0.18 0.48 0.04 0.22 0.04 2.95 0.13 0.04 0.13 0.03 0.16 0.15 8.78
16 69.6 157 57.2 3.31 6.59 0.34 0.07 0.18 0.03 0.06 0.02 1.07 0.04 0.04 0.03 0.03 0.07 0.16 14.0
17 60.6 64.1 21.0 1.03 2.11 0.12 0.03 0.07 0.03 0.05 0.02 0.30 0.04 0.04 0.02 0.03 0.07 0.03 12.3
AVERAGE 73.5 195 178 15.6 46.1 4.46 0.59 1.41 0.13 0.44 0.07 2.63 0.14 0.05 0.10 0.03 0.09 0.21 8.94
MIN 41.8 22.8 8.70 0.47 1.08 0.07 0.03 0.03 0.03 0.05 0.02 0.09 0.04 0.04 0.02 0.03 0.07 0.03 6.19
MAX 114 990 1250 115 360 37.2 7.84 18.3 1.52 4.92 0.62 19.9 1.11 0.14 0.78 0.11 0.26 2.01 14.0
REVSTD 23%
140% 194% 204% 216% 230% 266% 261% 235% 231% 193% 167% 168%
52%
165%
55% 55%
202%
25%
0
20
40
60
80
100
120
0
5
10
15
20
Distillation Feed, g/L HCl
Cycle
Table 13.25 - Feed (Barren PLS) Composition to Distillation Column
contains recoverable acid and REEs


