Rare Element Resources
Bear Lodge Project
Canadian NI 43-101 Technical Report
October 9
th
, 2014
10135-200-46 – Rev. 0
11-20
11.6.11 2010-2013 Check Analysis Programs
Four check analysis programs were conducted utilizing samples from the annual drill
programs. The check samples were randomly selected from the population of
samples with TREO grades exceeding 1.0% for each year. The 2010 and 2011 sets
of check samples were sent to Actlabs for analysis. The 2012 and 2013 check
analysis samples were sent to ALS for analysis, as both labs use a comparable
analytical method to analyze for the REE elements. Standards, blanks, and pulp
duplicates were included to monitor analytical accuracy and precision. These quality
control samples indicated acceptable accuracy and precision within each check
program. The results for the check analysis programs are presented in Table 11.5
and Figure 11.3.
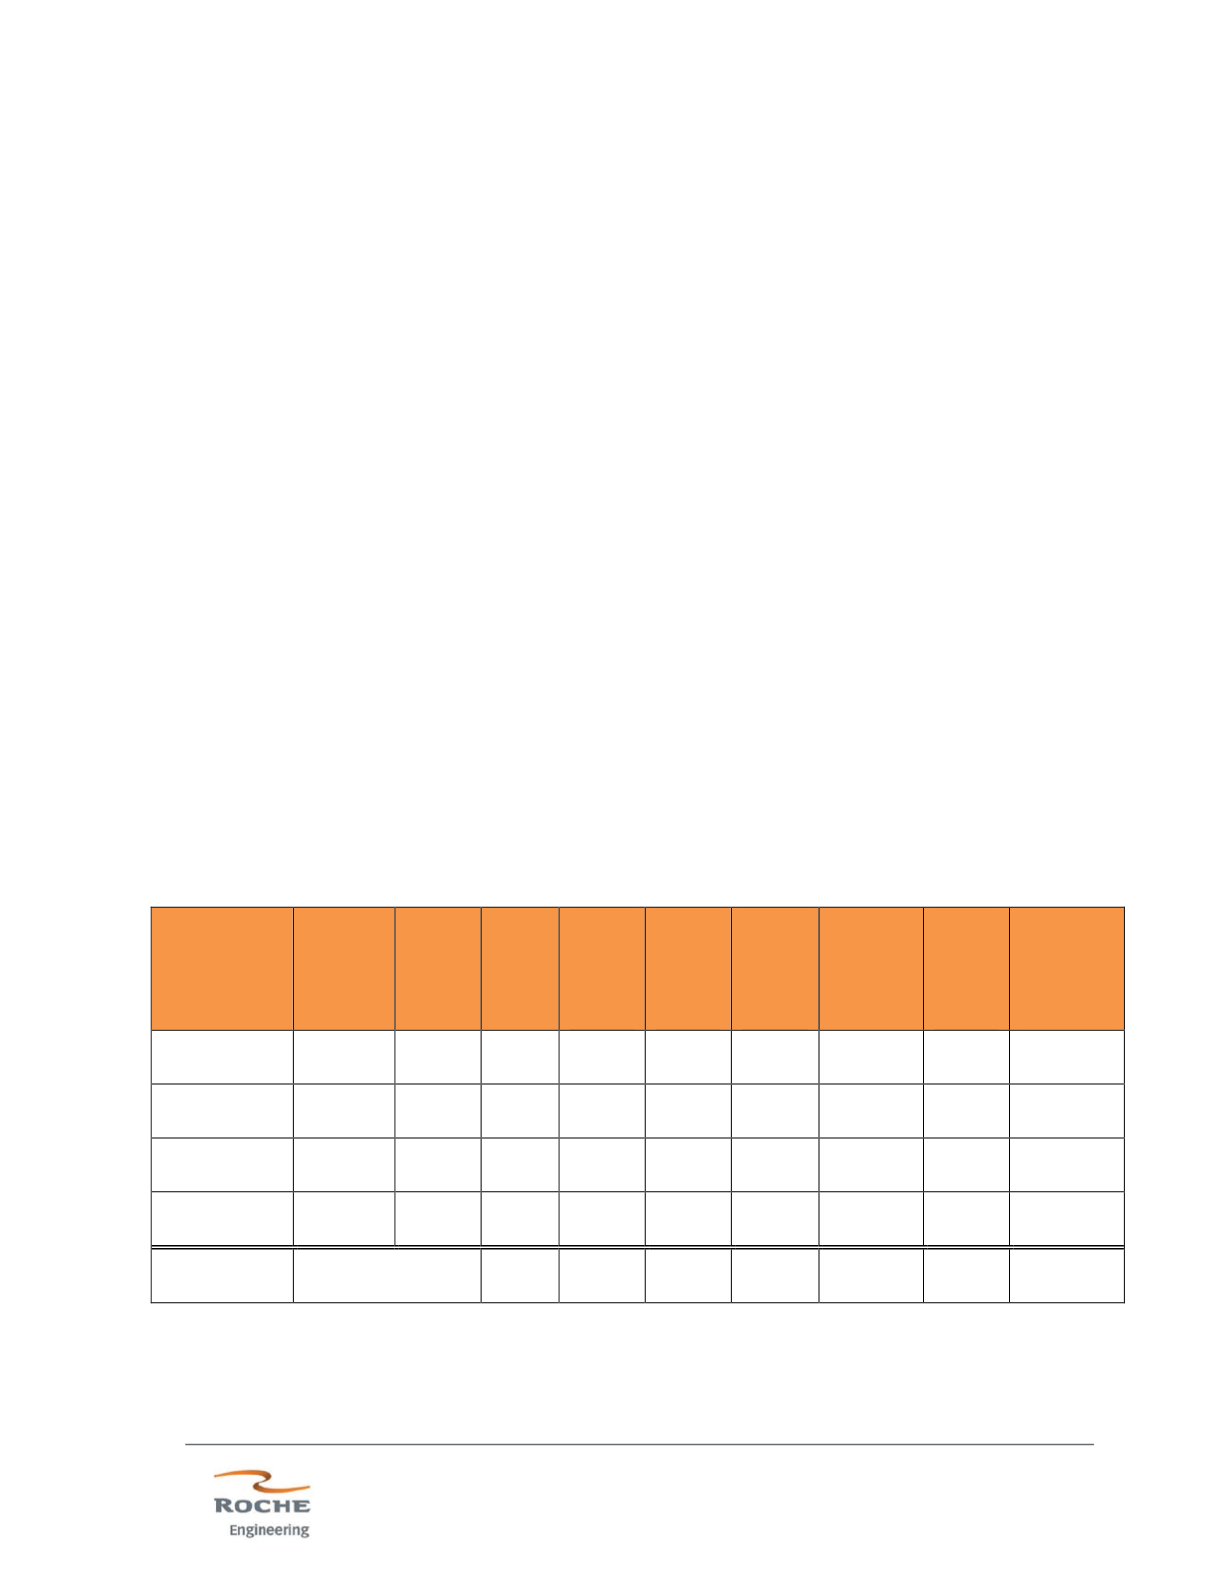
Five hundred and eighteen check samples were analyzed from 2010 to 2013 at
ActLabs and ALS. All check analyses show strong correlation and acceptable
precision for TREO. Precision varied from 5.2 to 11.8%. The bias between
laboratories varies from -0.5% in 2013 to 9.0% in 2010. However, the overall bias
averages around 2.6% between the two laboratories, which is within acceptable
limits. For 2010 to 2013 inclusive, more than 89% of check analyses are within ±
10% of the original analyses (the N<10% column), and more than 96% of the check
analyses are within ± 20% (the N<20% column) of one another.
Table 11.5 - 2010-2013 Check Analysis Results
1° Lab
Check
Lab
Year
N =
Min
TREO
%
Max
TREO
%
Actlabs
Bias
(%)
Precision
(%)
N <
10%
(%)
N<
20%
(%)
ALS
Actlabs
2010
75
0.99
11.3
5.8
7.6
92
97
ALS
Actlabs
2011
163
0.93
24
1.6
5.2
96
99
Actlabs
ALS
2012
114
0.91
5.08
9
11.8
72
96
Actlabs
ALS
2013
166
0.99
24.22
-0.5
8.8
92
94
2010-2013
518
0.91
24.2
2.6
8.7
89
96
(Jaacks, 2014)


