Rare Element Resources
Bear Lodge Project
Canadian NI 43-101 Technical Report
October 9
th
, 2014
10135-200-46 – Rev. 0
22-3
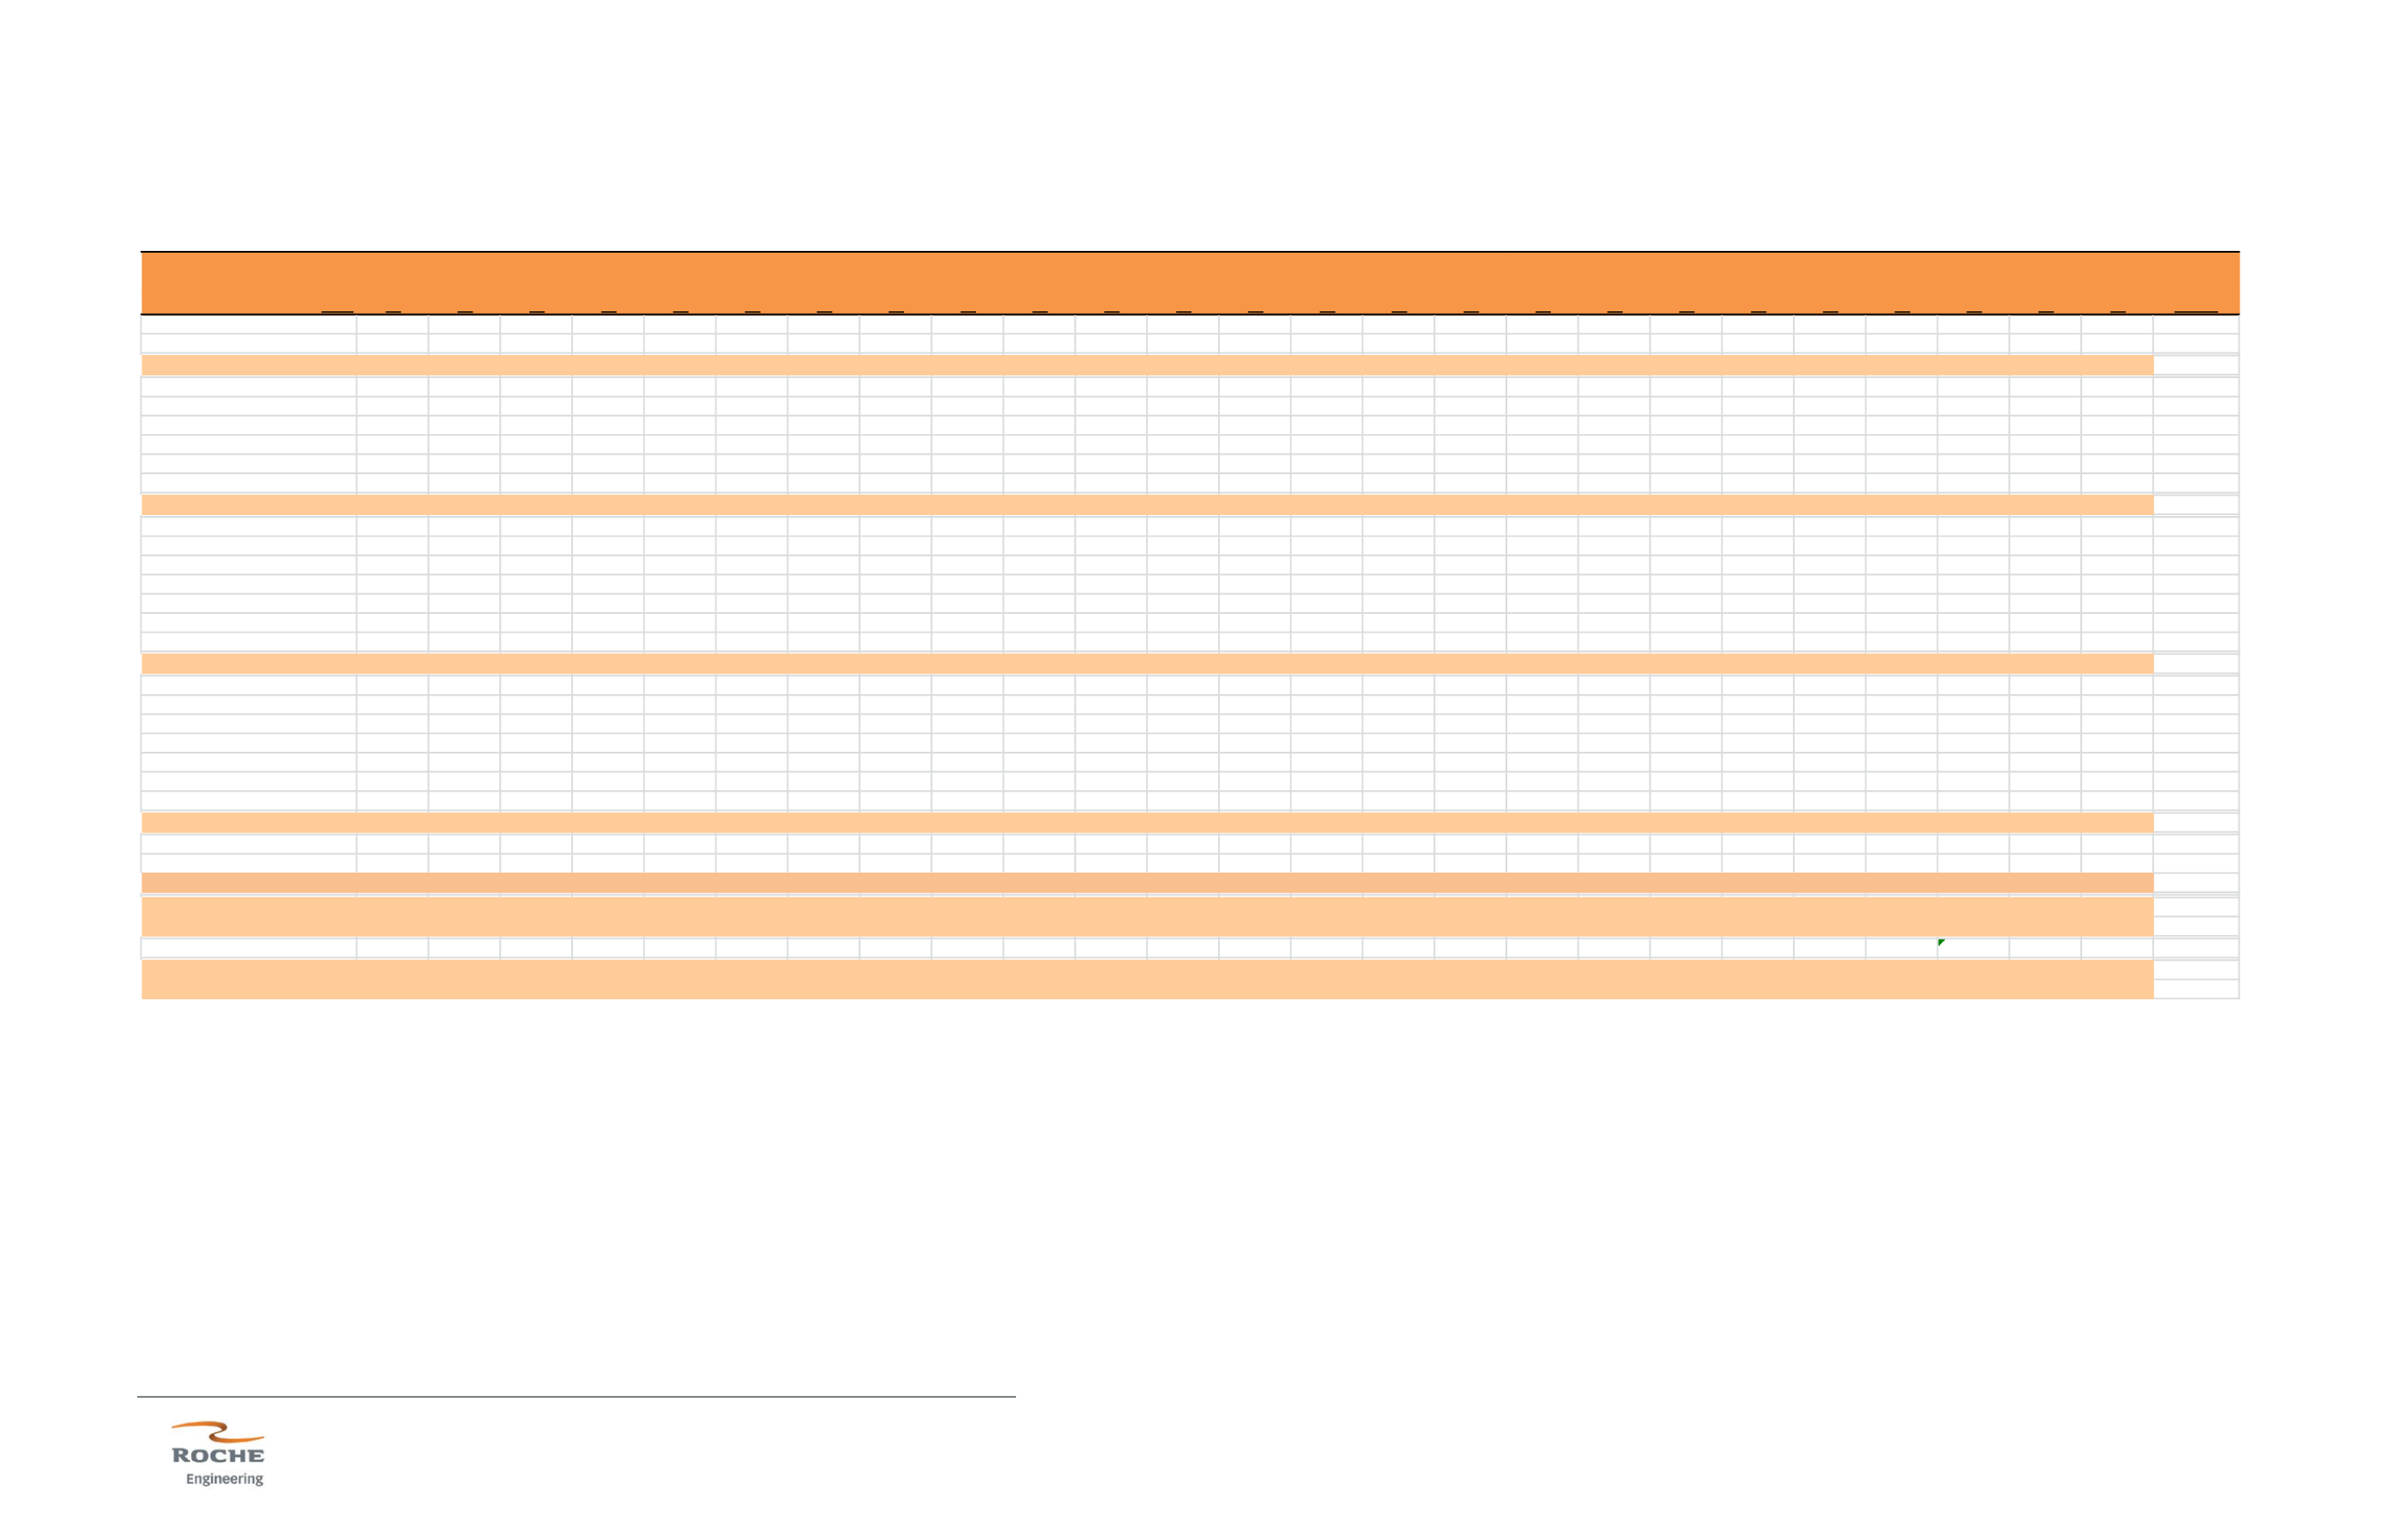
Table 22.2 - Cash Flow Forecast – Continued
Rare Elements Earth Resource 24
25
26
27
28
29
30
31
32
33
34
35
36
37
38
39
40
41
42
43
44
45
46
47
48
Bear Lodge REEProject - Financial Analysis
Year
26
27
28
29
30
31
32
33
34
35
36
37
38
39
40
41
42
43
44
45
46
47
48
49
50
Totals
Mine Plan, Tons
PUG Feed Rate, STPY
321
299
547
547
414
293
274
268
331
535
293
246
246
333
422
423
423
423
423
423
423
422
0
0
0
15,544
PUG Feed Rate, STPY
321
299
547
547
414
293
274
268
331
535
293
246
246
333
422
423
423
423
423
423
423
422
0
0
0
15,544
Capital Costs
PUG
0
0
0
0
0
0
0
0
0
0
0
0
0
0
0
0
0
0
0
0
0
0
0
0
0
67,982
Hydromet
0
0
0
0
0
0
0
0
0
0
0
0
0
0
0
0
0
0
0
0
0
0
0
0
0 168,226
Capital Replacement
0
0
0
0
0
0
0
0
0
0
0
0
0
0
0
0
0
0
0
0
0
0
0
0
0
0
Sub Consultant Costs
1,814
0
0
0 1,814
0 20,027
0 3,280
0
0
0 1,814
0
0
0 2,267
0
0
0
0
0 3,656 11,176 5,021 217,146
Working Capital
0
0
0
0
0
0
0
0
0
0
0
0
0
0
0
0
0
0
0
0
0 -24,603
Annual Cap cost
1,814
0
0
0 1,814
0 20,027
0 3,280
0
0
0 1,814
0
0
0 2,267
0
0
0
0 -24,603 3,656 11,176 5,021
453,354
Operating Costs
PUG
7,213 6,535 11,380 11,381 8,895 6,439 6,128 6,051 7,367 11,147 6,585 5,554 5,592 7,461 9,116 9,372 9,373 9,373 9,373 9,373 9,373 9,355
0
0
0 335,187
Hydromet
73,403 76,675 102,576 92,221 79,922 70,707 72,618 74,845 77,867 93,697 78,631 74,587 74,225 80,515 84,353 62,009 62,046 62,046 62,046 62,046 62,046 51,033
0
0
0 3,269,803
Mining Operations
19,651 19,644 19,598 19,598 19,556 19,454 19,448 19,446 19,466 19,352 11,904 8,952 8,917 9,096 9,222 6,229 6,229 6,229 5,837 5,837 5,837 5,837
0
0
0 668,123
Upton TSF Operations
801
801
801
801
801
801
801
801
801
801
801
801
801
801
801
801
801
801
801
801
801
801
0
0
0
36,053
G&A Operating Costs
6,603 6,603 6,603 6,603 6,603 6,603 6,603 6,603 6,603 6,603 6,603 6,603 6,603 6,603 6,603 6,603 6,603 6,603 6,603 6,603 6,603 5,431
0
0
0 295,983
Miller Creek Road Maint.
230
230
230
230
230
230
230
230
230
230
230
230
230
230
230
230
230
230
230
230
230
230
0
0
0
10,350
Annual Op Cost
107,902 110,489 141,189 130,834 116,006 104,235 105,828 107,976 112,334 131,831 104,754 96,728 96,369 104,707 110,325 85,245 85,283 85,283 84,890 84,890 84,890 72,686
0
0
0
4,615,498
Annual Revenue
Market Price per Kg
$24.60 $24.60 $24.60 $24.60 $24.60 $24.60 $24.60 $24.60 $24.60 $24.60 $24.60 $24.60 $24.60 $24.60 $24.60 $24.60 $24.60 $24.60 $24.60 $24.60 $24.60 $24.60
Market Price per st
$22,317 $22,317 $22,317 $22,317 $22,317 $22,317 $22,317 $22,317 $22,317 $22,317 $22,317 $22,317 $22,317 $22,317 $22,317 $22,317 $22,317 $22,317 $22,317 $22,317 $22,317 $22,317
Ore Grade,(% REO)
2.74
2.94
1.85
1.83
2.31
3.15
3.24
3.26
2.70
1.92
2.89
3.19
3.09
2.46
2.11
1.73
1.73
1.73
1.73
1.73
1.73
1.73
Overall Recovery,%
81.1% 82.7% 73.2% 71.7% 75.4% 80.9% 82.4% 83.6% 81.2% 72.2% 82.6% 84.7% 84.7% 82.3% 76.9% 75.5% 75.5% 75.5% 75.5% 75.5% 75.5% 75.5%
Rare Earth Mineral, tons
7,135 7,260 7,394 7,191 7,201 7,468 7,314 7,292 7,260 7,418 6,987 6,639 6,443 6,731 6,847 5,637 5,637 5,637 5,637 5,637 5,637 4,134
337,971
Rare Earth Mineral, $
159,231 162,021 165,005 160,474 160,704 166,665 163,219 162,731 162,031 165,548 155,930 148,152 143,778 150,205 152,813 125,809 125,809 125,809 125,809 125,809 125,809 92,250
7,542,411
Annual Tot Rev
159,231 162,021 165,005 160,474 160,704 166,665 163,219 162,731 162,031 165,548 155,930 148,152 143,778 150,205 152,813 125,809 125,809 125,809 125,809 125,809 125,809 92,250
0
0
0
7,542,411
State Tax
2,726 2,690 2,108 2,198 2,465 2,839 2,721 2,840 2,694 2,349 1,778 1,407 1,346 1,308 1,253
931
905
902
847
840
836
57
54
52
Federal Tax
8,907 9,096 3,846 5,015 7,957 11,406 10,284 9,674 8,738 5,575 9,207 9,357 8,551 8,152 7,576 7,300 7,475 7,653 7,775 7,809 7,810 3,596
-111
-246
Taxes
11,633 11,786 5,954 7,213 10,422 14,245 13,005 12,514 11,432 7,924 10,985 10,764 9,897 9,460 8,829 8,231 8,380 8,555 8,622 8,649 8,646 3,653
-57
-194
569,736
Pre Tax Cash Flow
46,790 48,842 21,709 27,442 40,419 59,591 34,644 51,915 43,723 31,368 49,398 50,018 44,249 44,190 41,235 39,634 37,354 39,625 40,072 40,079 40,083 44,109 -3,709 -11,228 -5,021
After Tax Cash Flow
37,883 39,746 17,863 22,427 32,462 48,185 24,360 42,241 34,985 25,793 40,191 40,661 35,698 36,038 33,659 32,334 29,879 31,972 32,297 32,270 32,273 40,513 -3,598 -10,982 -5,021
1,903,822
Cumulative After Tax Cash Flow 1,217,577 1,257,322 1,275,185 1,297,612 1,330,074 1,378,260 1,402,619 1,444,860 1,479,845 1,505,638 1,545,829 1,586,490 1,622,187 1,658,225 1,691,884 1,724,218 1,754,097 1,786,069 1,818,366 1,850,637 1,882,910 1,923,423 1,879,311 1,868,329 1,863,309 53,324,719
Annual Pre Tax Disc. Cash
3,926 3,726 1,505 1,730 2,316 3,105 1,641 2,235 1,711 1,116 1,598 1,471 1,183 1,074
911
796
682
658
605
550
500
500
-38
-105
-43
Annual Post Tax Disc. Cash
3,179 3,032 1,239 1,414 1,860 2,510 1,154 1,819 1,369
918 1,300 1,196
954
876
744
649
546
531
487
443
403
459
-37
-103
-43
331,442
(Roche, 2014)


