Rare Element Resources
Bear Lodge Project
Canadian NI 43-101 Technical Report
October 9
th
, 2014
10135-200-46 – Rev. 0
11-21
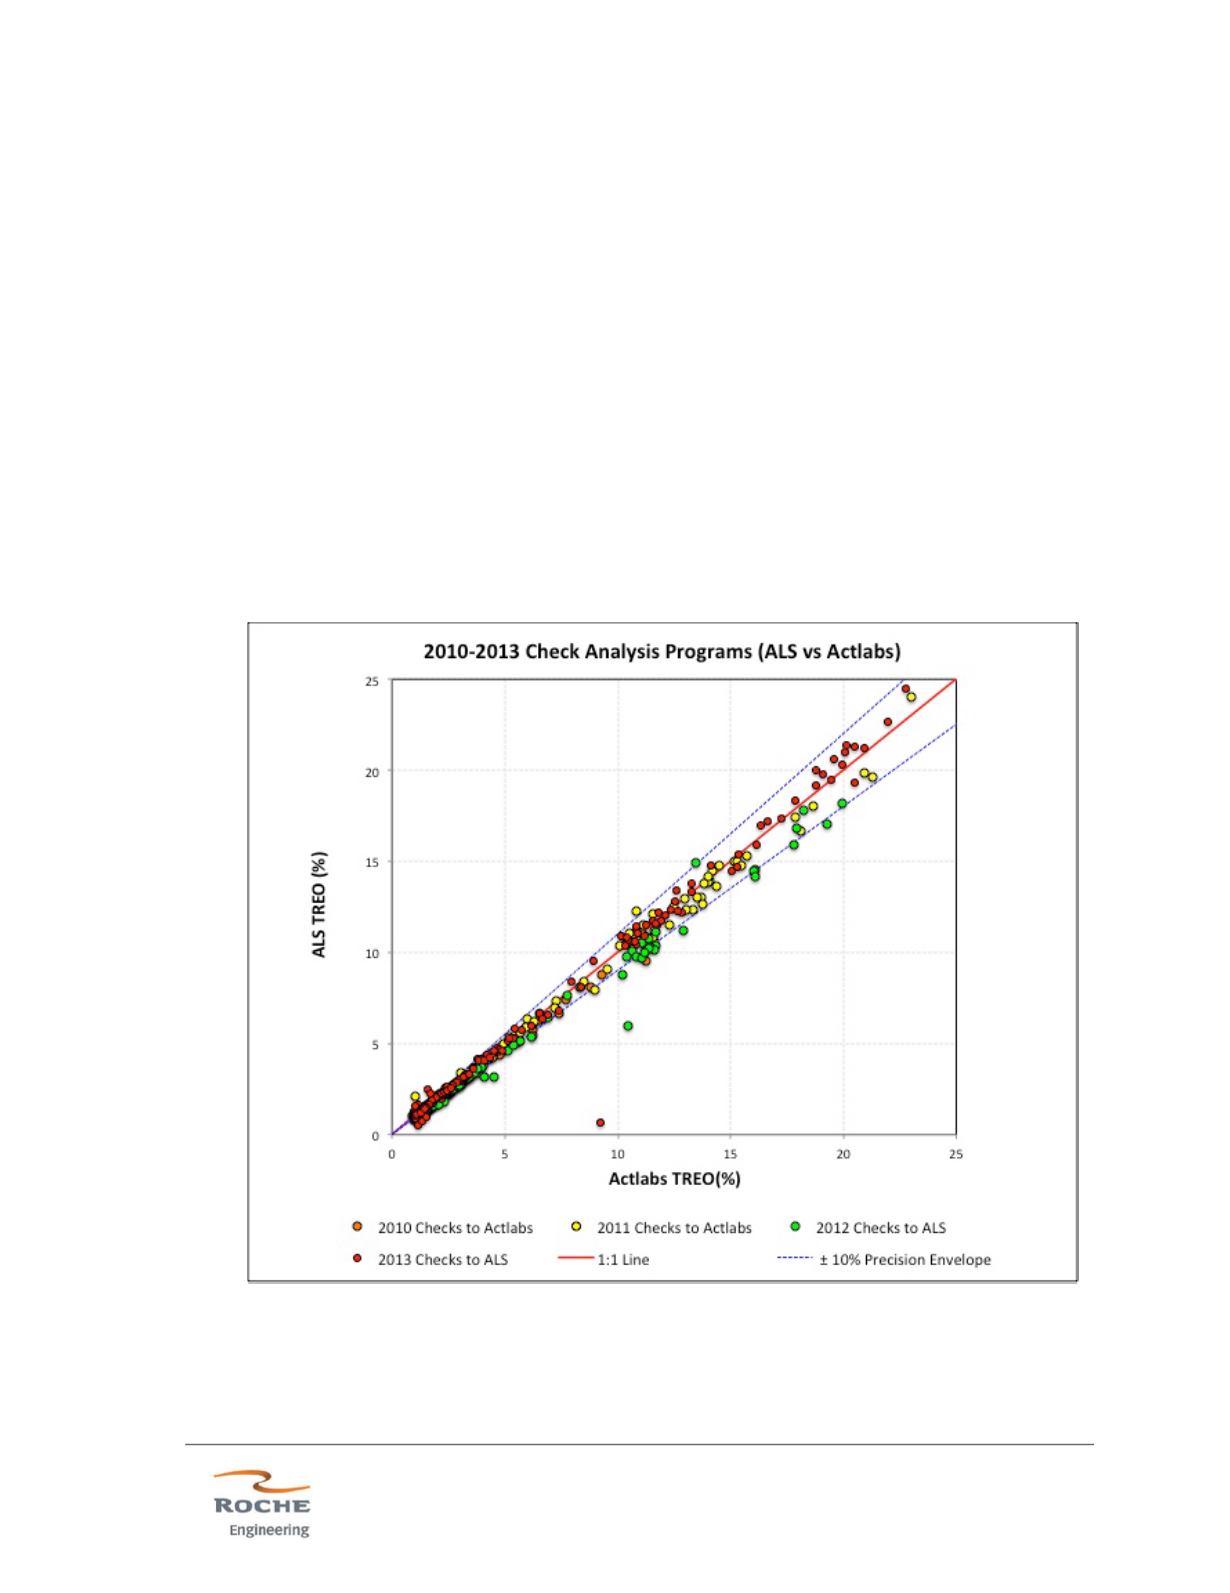
11.6.12 Check Analysis Program Quality Control Graph
Figure 11.3 shows the quality control plot for the combined 2010-2013 check analysis
programs for TREO. A precision envelope of ± 10% is shown in blue dashed lines
centered about the solid red 1:1 line for the check analyses. 2010 check analyses
are shown with orange dots, 2011 check analyses are shown with yellow dots, 2012
check analyses are shown with the green dots, and 2013 check analyses are shown
with the red dots. Correlation within any given year is excellent. One may observe
that the 2010 and 2012 groupings are more biased (closer to the 10% control limit)
than the 2011 or 2013 check analyses, which lie closer to the 1:1 red line.
Figure 11.3 - 2010-2013 Check Analysis for % TREO
(Jaacks, 2014)


